Note
Go to the end to download the full example code
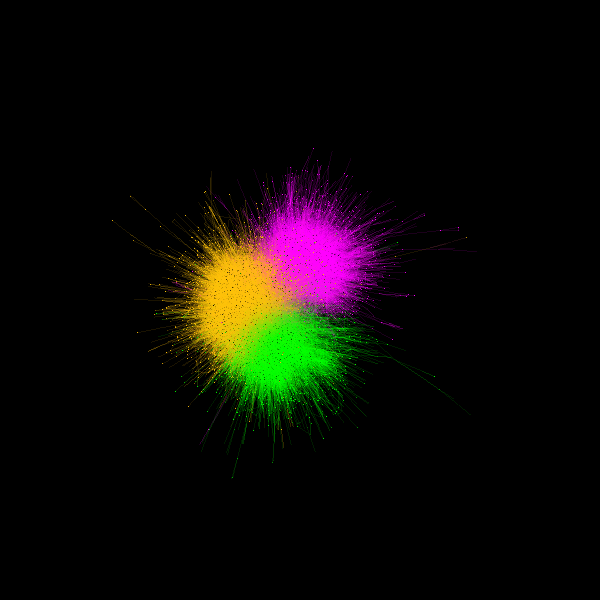
Visualize Interdisciplinary map of the journals network#
The goal of this app is to show an overview of the journals network structure as a complex network. Each journal is shown as a node and their connections indicates a citation between two of them.
First, let’s import some useful functions
from os.path import join as pjoin

import numpy as np

import fury
Then let’s download some available datasets.
files, folder = fury.data.fetch_viz_wiki_nw()
categories_file, edges_file, positions_file = sorted(files.keys())
Dataset is already in place. If you want to fetch it again please first remove the folder /Users/skoudoro/.fury/examples/wiki_nw
More information about complex networks can be found in this papers: https://arxiv.org/abs/0711.3199
We read our datasets
positions = np.loadtxt(pjoin(folder, positions_file))
categories = np.loadtxt(pjoin(folder, categories_file), dtype=str)
edges = np.loadtxt(pjoin(folder, edges_file), dtype=int)
We attribute a color to each category of our dataset which correspond to our nodes colors.
category2index = {category: i for i, category in enumerate(np.unique(categories))}

index2category = np.unique(categories)

categoryColors = fury.colormap.distinguishable_colormap(nb_colors=len(index2category))

colors = np.array([categoryColors[category2index[category]] for category in categories])
We define our node size
radii = 1 + np.random.rand(len(positions))
Lets create our edges now. They will indicate a citation between two nodes. OF course, the colors of each edges will be an interpolation between the two node that it connects.
edgesPositions = []
edgesColors = []
for source, target in edges:
    edgesPositions.append(np.array([positions[source], positions[target]]))
    edgesColors.append(np.array([colors[source], colors[target]]))

edgesPositions = np.array(edgesPositions)
edgesColors = np.average(np.array(edgesColors), axis=1)
Our data preparation is ready, it is time to visualize them all. We start to build 2 actors that we represent our data : sphere_actor for the nodes and lines_actor for the edges.
sphere_actor = fury.actor.sphere(
    centers=positions,
    colors=colors,
    radii=radii * 0.5,
    theta=8,
    phi=8,
)

lines_actor = fury.actor.line(
    edgesPositions,
    colors=edgesColors,
    opacity=0.1,
)
All actors need to be added in a scene, so we build one and add our lines_actor and sphere_actor.
scene = fury.window.Scene()

scene.add(lines_actor)
scene.add(sphere_actor)
The final step ! Visualize and save the result of our creation! Please, switch interactive variable to True if you want to visualize it.
interactive = False

if interactive:
    fury.window.show(scene=scene, size=(600, 600))

fury.window.record(scene=scene, out_path="journal_networks.png", size=(600, 600))
This example can be improved by adding some interactivy with slider, picking, etc. Play with it, improve it!
Total running time of the script: (0 minutes 0.775 seconds)