Note
Click here to download the full example code
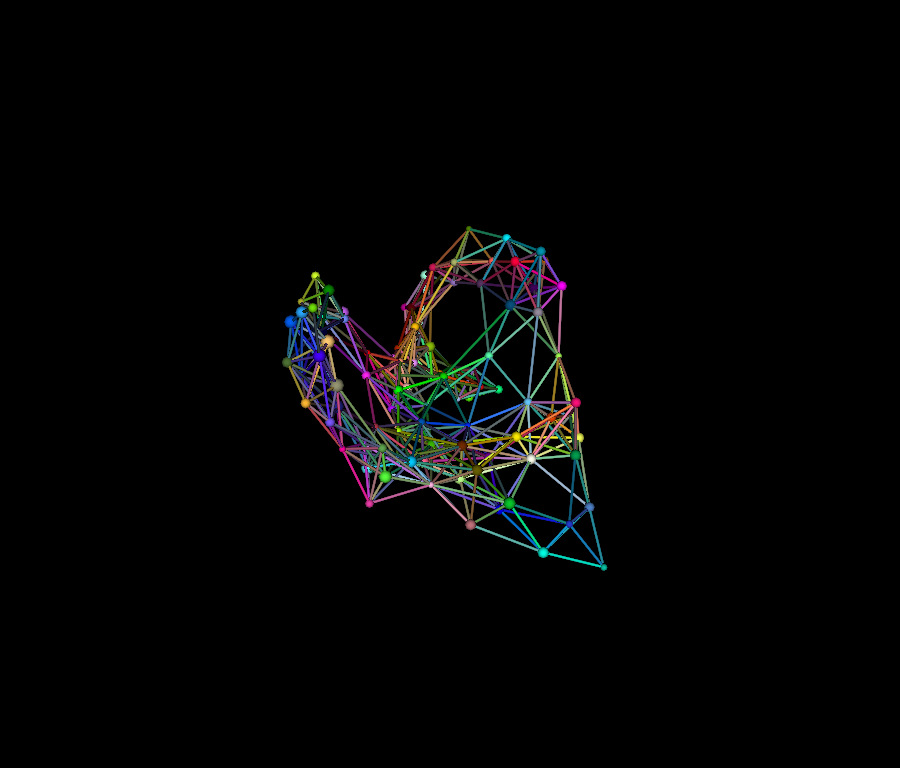
Visualize Networks (Animated version)
The goal of this demo is to show how to visualize a complex network and use an force directed algorithm to layout the network. A simpler animation of the network made by adding some random displacements to nodes positions is also demoed.
First, let’s import some useful functions
import math
from os.path import join as pjoin
import numpy as np
from vtk.util import numpy_support
from fury import actor, window, colormap as cmap
This demo has two modes. Use mode = 0 to visualize a randomly generated geographic network by iterating it using a force-directed layout heuristic.
Use mode = 1 to visualize a large network being animated with random displacements
mode = 0
Then let’s download some available datasets. (mode 1)
if(mode == 1):
    from fury.data.fetcher import fetch_viz_wiki_nw

    files, folder = fetch_viz_wiki_nw()
    categories_file, edges_file, positions_file = sorted(files.keys())
We read our datasets (mode 1)
if(mode == 1):
    positions = np.loadtxt(pjoin(folder, positions_file))
    categories = np.loadtxt(pjoin(folder, categories_file), dtype=str)
    edges = np.loadtxt(pjoin(folder, edges_file), dtype=int)
    vertices_count = len(positions)
Generate a geographic random network, requires networkx package (mode 0)
if(mode == 0):
    import networkx as nx
    vertices_count = 100
    view_size = 100
    network = nx.random_geometric_graph(vertices_count, 0.2)
    positions = view_size * \
        np.random.random((vertices_count, 3)) - view_size / 2.0
    categories = np.arange(0, vertices_count)
    edges = np.array(network.edges())
    positions = view_size * \
        np.random.random((vertices_count, 3)) - view_size / 2.0
We attribute a color to each category of our dataset which correspond to our nodes colors.
category2index = {category: i
                  for i, category in enumerate(np.unique(categories))}

index2category = np.unique(categories)

category_colors = cmap.distinguishable_colormap(nb_colors=len(index2category))

colors = np.array([category_colors[category2index[category]]
                   for category in categories])
We define our node size
radii = 1 + np.random.rand(len(positions))
Let’s create our edges now. They will indicate a citation between two nodes. The colors of each edge are interpolated between the two endpoints.
edges_colors = []
for source, target in edges:
    edges_colors.append(np.array([colors[source], colors[target]]))

edges_colors = np.average(np.array(edges_colors), axis=1)
Our data preparation is ready, it is time to visualize them all. We start to build 2 actors that we represent our data : sphere_actor for the nodes and lines_actor for the edges.
sphere_actor = actor.sphere(centers=np.zeros(positions.shape),
                            colors=colors,
                            radii=radii * 0.5,
                            theta=8,
                            phi=8)


lines_actor = actor.line(np.zeros((len(edges), 2, 3)),
                         colors=edges_colors, lod=False,
                         fake_tube=True, linewidth=3)
Defining timer callback and layout iterator
def new_layout_timer(showm, edges_list, vertices_count,
                     max_iterations=1000, vertex_initial_positions=None):
    view_size = 500
    viscosity = 0.10
    alpha = 0.5
    a = 0.0005
    b = 1.0
    deltaT = 1.0

    sphere_geometry = np.array(numpy_support.vtk_to_numpy(
        sphere_actor.GetMapper().GetInput().GetPoints().GetData()))
    geometry_length = sphere_geometry.shape[0] / vertices_count

    if(vertex_initial_positions is not None):
        pos = np.array(vertex_initial_positions)
    else:
        pos = view_size * \
            np.random.random((vertices_count, 3)) - view_size / 2.0

    velocities = np.zeros((vertices_count, 3))

    def iterate(iterationCount):
        nonlocal pos, velocities
        for _ in range(iterationCount):
            forces = np.zeros((vertices_count, 3))
            # repulstive forces
            for vertex1 in range(vertices_count):
                for vertex2 in range(vertex1):
                    x1, y1, z1 = pos[vertex1]
                    x2, y2, z2 = pos[vertex2]
                    distance = math.sqrt(
                        (x2 - x1) * (x2 - x1) +
                        (y2 - y1) * (y2 - y1) +
                        (z2 - z1) * (z2 - z1)) + alpha
                    rx = (x2 - x1) / distance
                    ry = (y2 - y1) / distance
                    rz = (z2 - z1) / distance
                    Fx = -b * rx / distance / distance
                    Fy = -b * ry / distance / distance
                    Fz = -b * rz / distance / distance
                    forces[vertex1] += np.array([Fx, Fy, Fz])
                    forces[vertex2] -= np.array([Fx, Fy, Fz])
            # attractive forces
            for vFrom, vTo in edges_list:
                if(vFrom == vTo):
                    continue
                x1, y1, z1 = pos[vFrom]
                x2, y2, z2 = pos[vTo]
                distance = math.sqrt(
                    (x2 - x1) * (x2 - x1) +
                    (y2 - y1) * (y2 - y1) +
                    (z2 - z1) * (z2 - z1))
                Rx = (x2 - x1)
                Ry = (y2 - y1)
                Rz = (z2 - z1)
                Fx = a * Rx * distance
                Fy = a * Ry * distance
                Fz = a * Rz * distance
                forces[vFrom] += np.array([Fx, Fy, Fz])
                forces[vTo] -= np.array([Fx, Fy, Fz])
            velocities += forces * deltaT
            velocities *= (1.0 - viscosity)
            pos += velocities * deltaT
        pos[:, 0] -= np.mean(pos[:, 0])
        pos[:, 1] -= np.mean(pos[:, 1])
        pos[:, 2] -= np.mean(pos[:, 2])
    counter = 0

    def _timer(_obj, _event):
        nonlocal counter, pos
        counter += 1
        if(mode == 0):
            iterate(1)
        else:
            pos[:] += (np.random.random(pos.shape) - 0.5) * 1.5
        spheres_positions = numpy_support.vtk_to_numpy(
            sphere_actor.GetMapper().GetInput().GetPoints().GetData())
        spheres_positions[:] = sphere_geometry + \
            np.repeat(pos, geometry_length, axis=0)

        edges_positions = numpy_support.vtk_to_numpy(
            lines_actor.GetMapper().GetInput().GetPoints().GetData())
        edges_positions[::2] = pos[edges_list[:, 0]]
        edges_positions[1::2] = pos[edges_list[:, 1]]

        lines_actor.GetMapper().GetInput().GetPoints().GetData().Modified()
        lines_actor.GetMapper().GetInput().ComputeBounds()

        sphere_actor.GetMapper().GetInput().GetPoints().GetData().Modified()
        sphere_actor.GetMapper().GetInput().ComputeBounds()
        showm.scene.ResetCameraClippingRange()
        showm.render()

        if counter >= max_iterations:
            showm.exit()
    return _timer
All actors need to be added in a scene, so we build one and add our lines_actor and sphere_actor.
scene = window.Scene()

camera = scene.camera()

scene.add(lines_actor)
scene.add(sphere_actor)
The final step! Visualize the result of our creation! Also, we need to move the camera a little bit farther from the network. you can increase the parameter max_iteractions of the timer callback to let the animation run for more time.
showm = window.ShowManager(scene, reset_camera=False, size=(
    900, 768), order_transparent=True, multi_samples=8)

showm.initialize()

scene.set_camera(position=(0, 0, -300))

timer_callback = new_layout_timer(
    showm, edges, vertices_count,
    max_iterations=200,
    vertex_initial_positions=positions)


# Run every 16 milliseconds
showm.add_timer_callback(True, 16, timer_callback)

showm.start()

window.record(showm.scene, size=(900, 768),
              out_path="viz_animated_networks.png")
Total running time of the script: ( 0 minutes 15.709 seconds)