Note
Click here to download the full example code
Visualize bundles and metrics on bundles
First, let’s download some available datasets. Here we are using a dataset which provides metrics and bundles.
import numpy as np
from fury import window, actor
from dipy.data import fetch_bundles_2_subjects, read_bundles_2_subjects
from dipy.tracking.streamline import transform_streamlines

fetch_bundles_2_subjects()
dix = read_bundles_2_subjects(subj_id='subj_1', metrics=['fa'],
                              bundles=['cg.left', 'cst.right'])
Out:
Data size is approximately 234MB
Dataset is already in place. If you want to fetch it again please first remove the folder /Users/koudoro/.dipy/exp_bundles_and_maps
Store fractional anisotropy.
fa = dix['fa']
Store grid to world transformation matrix.
affine = dix['affine']
Store the cingulum bundle. A bundle is a list of streamlines.
bundle = dix['cg.left']
It happened that this bundle is in world coordinates and therefore we need to
transform it into native image coordinates so that it is in the same
coordinate space as the fa image.
bundle_native = transform_streamlines(bundle, np.linalg.inv(affine))
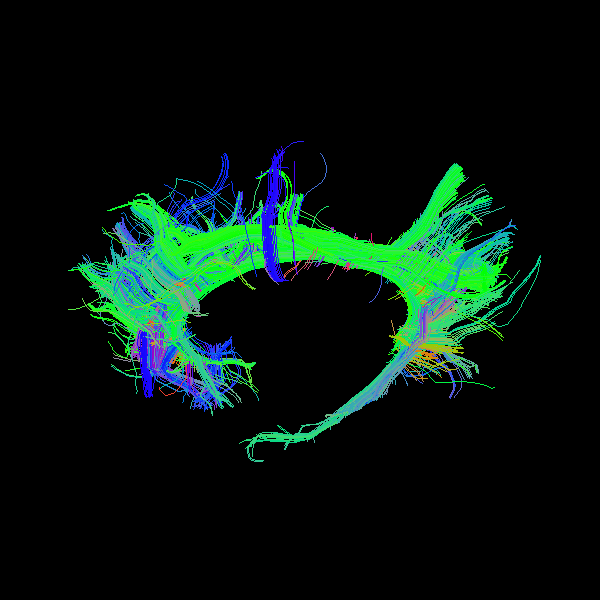
Show every streamline with an orientation color
This is the default option when you are using line or streamtube.
renderer = window.Renderer()

stream_actor = actor.line(bundle_native)

renderer.set_camera(position=(-176.42, 118.52, 128.20),
                    focal_point=(113.30, 128.31, 76.56),
                    view_up=(0.18, 0.00, 0.98))

renderer.add(stream_actor)

# Uncomment the line below to show to display the window
# window.show(renderer, size=(600, 600), reset_camera=False)
window.record(renderer, out_path='bundle1.png', size=(600, 600))
You may wonder how we knew how to set the camera. This is very easy. You just
need to run window.show once see how you want to see the object and then
close the window and call the camera_info method which prints the
position, focal point and view up vectors of the camera.
renderer.camera_info()
Out:
# Active Camera
   Position (-237.26, 116.47, 139.05)
   Focal Point (113.30, 128.31, 76.56)
   View Up (0.18, 0.00, 0.98)
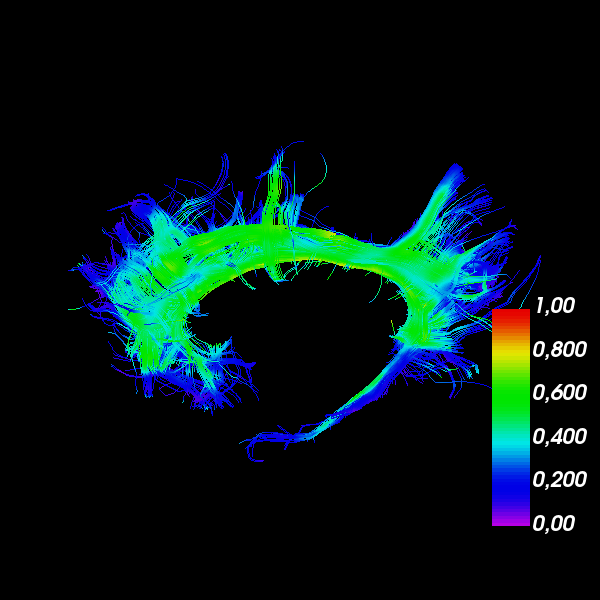
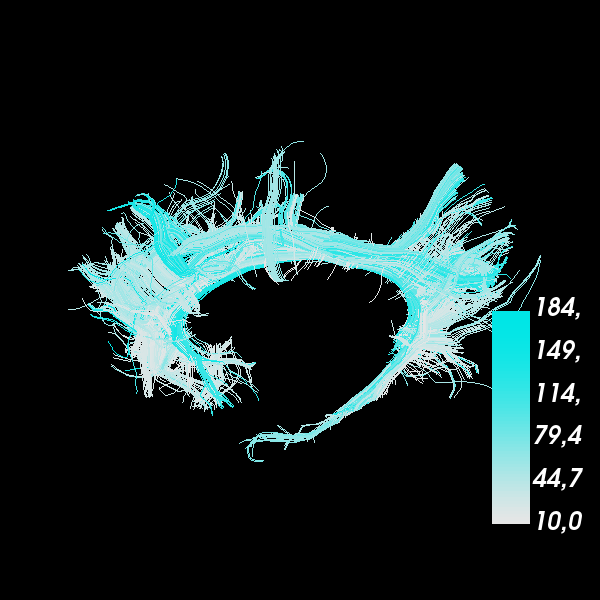
Show every point with a value from a volume with default colormap
Here we will need to input the fa map in streamtube or line.
renderer.clear()
stream_actor2 = actor.line(bundle_native, fa, linewidth=0.1)
We can also show the scalar bar.
bar = actor.scalar_bar()

renderer.add(stream_actor2)
renderer.add(bar)

# window.show(renderer, size=(600, 600), reset_camera=False)
window.record(renderer, out_path='bundle2.png', size=(600, 600))
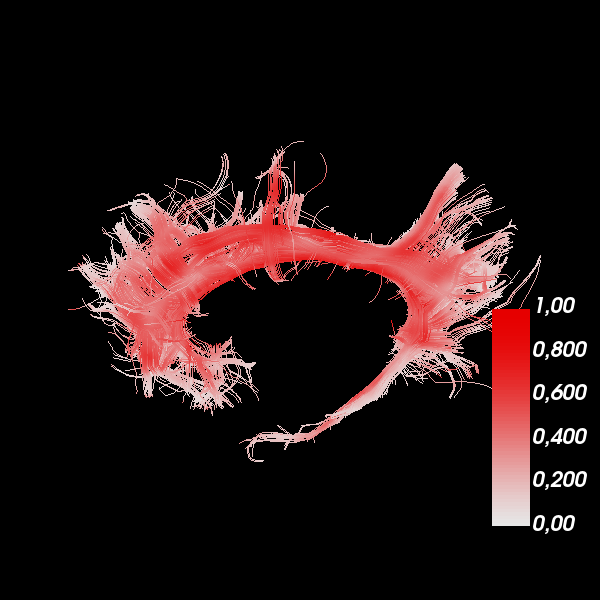
Show every point with a value from a volume with your colormap
Here we will need to input the fa map in streamtube
renderer.clear()

hue = (0.0, 0.0)  # red only
saturation = (0.0, 1.0)  # white to red

lut_cmap = actor.colormap_lookup_table(hue_range=hue,
                                       saturation_range=saturation)

stream_actor3 = actor.line(bundle_native, fa, linewidth=0.1,
                           lookup_colormap=lut_cmap)
bar2 = actor.scalar_bar(lut_cmap)

renderer.add(stream_actor3)
renderer.add(bar2)

# window.show(renderer, size=(600, 600), reset_camera=False)
window.record(renderer, out_path='bundle3.png', size=(600, 600))
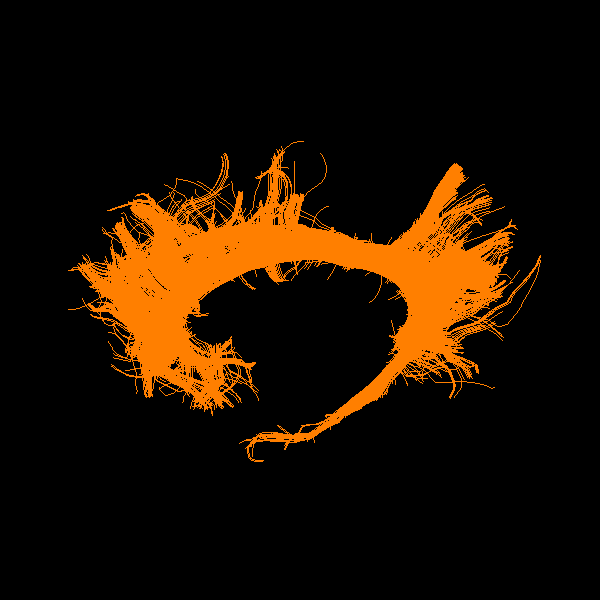
Show every bundle with a specific color
You can have a bundle with a specific color. In this example, we are chosing orange.
renderer.clear()
stream_actor4 = actor.line(bundle_native, (1., 0.5, 0), linewidth=0.1)

renderer.add(stream_actor4)

# window.show(renderer, size=(600, 600), reset_camera=False)
window.record(renderer, out_path='bundle4.png', size=(600, 600))
Show every streamline of a bundle with a different color
Let’s make a colormap where every streamline of the bundle is colored by its length.
renderer.clear()

from dipy.tracking.streamline import length

lengths = length(bundle_native)

hue = (0.5, 0.5)  # blue only
saturation = (0.0, 1.0)  # black to white

lut_cmap = actor.colormap_lookup_table(
    scale_range=(lengths.min(), lengths.max()),
    hue_range=hue,
    saturation_range=saturation)

stream_actor5 = actor.line(bundle_native, lengths, linewidth=0.1,
                           lookup_colormap=lut_cmap)

renderer.add(stream_actor5)
bar3 = actor.scalar_bar(lut_cmap)

renderer.add(bar3)

# window.show(renderer, size=(600, 600), reset_camera=False)
window.record(renderer, out_path='bundle5.png', size=(600, 600))
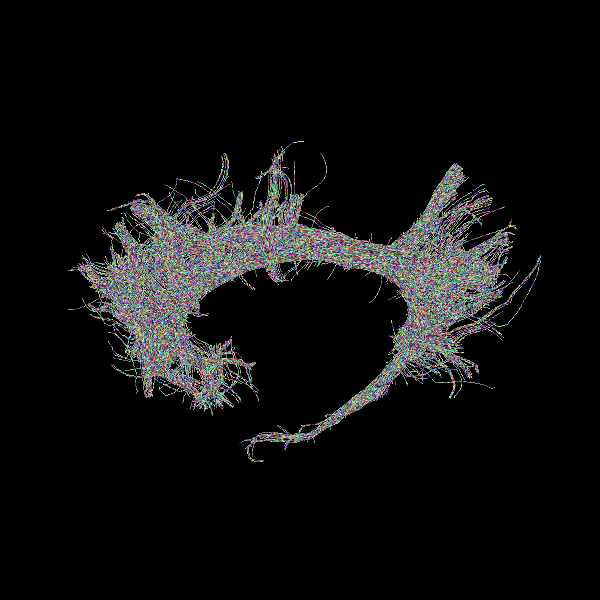
Show every point of every streamline with a different color
In this case in which we want to have a color per point and per streamline,
we can create a list of the colors to correspond to the list of streamlines
(bundles). Here in colors we will insert some random RGB colors.
renderer.clear()

colors = [np.random.rand(*streamline.shape) for streamline in bundle_native]

stream_actor6 = actor.line(bundle_native, colors, linewidth=0.2)

renderer.add(stream_actor6)

# window.show(renderer, size=(600, 600), reset_camera=False)
window.record(renderer, out_path='bundle6.png', size=(600, 600))
In summary, we showed that there are many useful ways for visualizing maps on bundles.
Total running time of the script: ( 0 minutes 4.604 seconds)