Note
Go to the end to download the full example code.
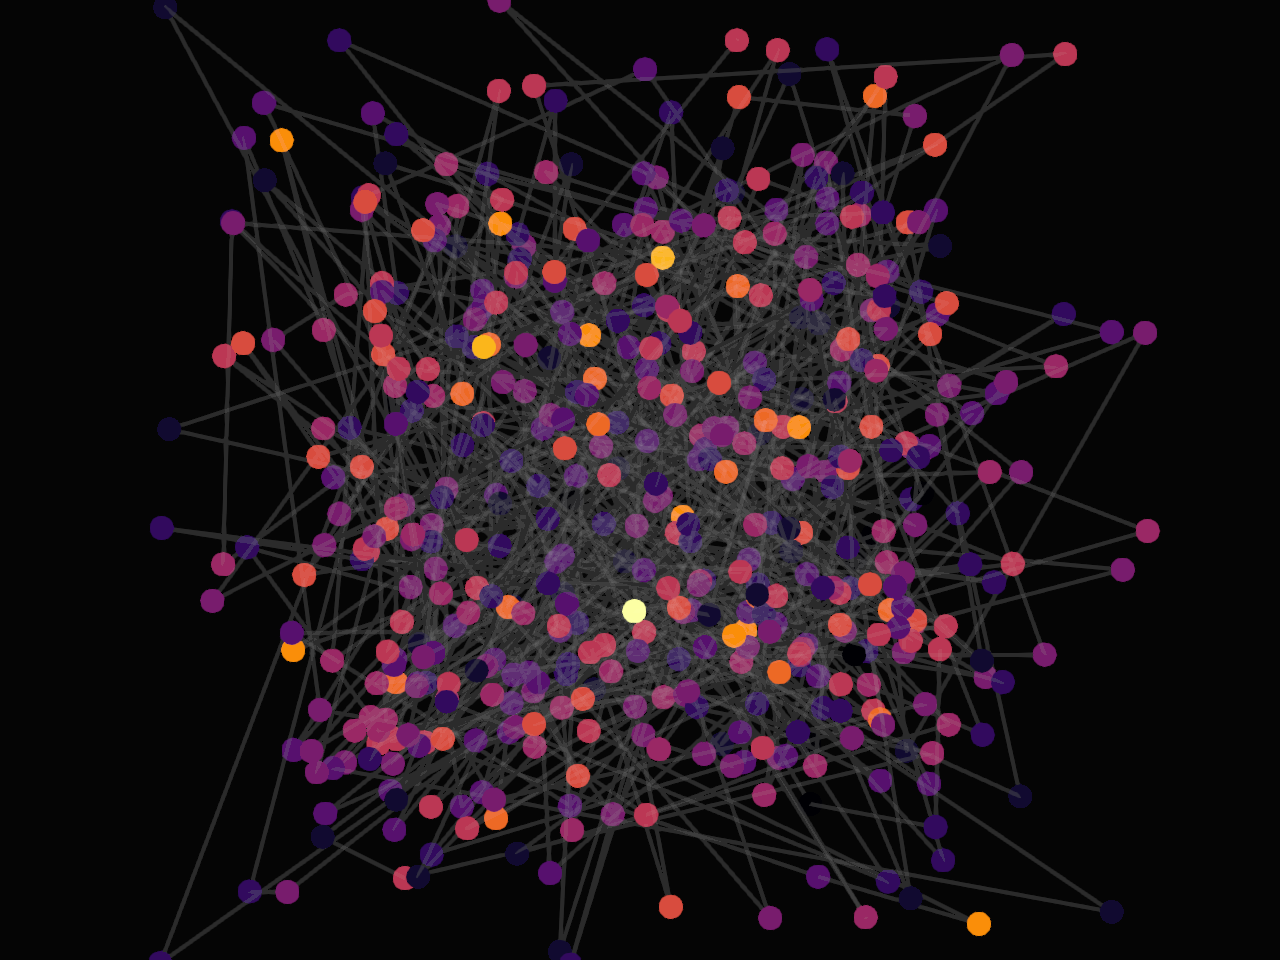
Force-Directed Network Visualization#
This example demonstrates the real-time simulation and visualization of structural networks using a high-performance GPU-accelerated Fruchterman-Reingold force-directed layout.
Import the required libraries and configure the network layout parameters.
import numpy as np
from fury import colormap, ui, window
from fury.network import Network

N_NODES = 500
N_EDGES = 1000
K_DISTANCE = 20.0
SIM_SPEED = 0.01
Generate random spatial coordinates and initialize connection links with colors. Alternatively, you can load a pre-existing network from GEXF, GML, or XNET files:
from fury.io import load_network nodes, edges, colors = load_network(“path/to/network/file.gexf”)
nodes = (np.random.rand(N_NODES, 3) - 0.5) * 100
edges = np.random.randint(0, N_NODES, size=(N_EDGES, 2))
edges = edges[edges[:, 0] != edges[:, 1]]  # Remove self-loops

# Calculate node degrees to map colors based on network connectivity.
degrees = np.zeros(N_NODES, dtype=np.float32)
for u, v in edges:
    degrees[u] += 1.0
    degrees[v] += 1.0

max_degree = np.max(degrees)
norm_degrees = degrees / max_degree if max_degree > 0 else degrees

colors = colormap.create_colormap(norm_degrees, name="inferno").astype(np.float32)
Initialize the composite Network actor to register compute and render pipelines.
network_actor = Network(
    nodes=nodes,
    edges=edges,
    colors=colors,
    k=K_DISTANCE,
    speed=SIM_SPEED,
    point_size=12.0,
    edge_opacity=0.15,
)
Set up the 3D scene viewport and apply a dark background layout context.
scene = window.Scene()
scene.background = (0.02, 0.02, 0.02)
scene.add(network_actor)
Add a 2D text overlay to display graph layout details.
info_text = (
    f"GPU Force-Directed Layout\n"
    f"Nodes: {network_actor.n_nodes} | Edges: {network_actor.n_edges}"
)

hud_label = ui.TextBlock2D(
    text=info_text,
    position=(30, 30),
    font_size=16,
    color=(0.9, 0.9, 0.95),
    bold=True,
    dynamic_bbox=True,
)
scene.add(hud_label)
Initialize the ShowManager, position the virtual camera and launch the rendering loop.
show_m = window.ShowManager(scene=scene, size=(1024, 768), title="Fury Network Layout")

# Position virtual camera to frame the entire layout structure.
camera = show_m.screens[0].camera
camera.local.position = (0.0, 0.0, 150.0)
camera.look_at((0.0, 0.0, 0.0))

show_m.start()
Total running time of the script: (0 minutes 0.741 seconds)